Library Marketing: Part 2

Idea Mapping Example, Library Marketing, Visualization No Comments »

For many years, we’ve measured the impact of the professional library and information services on investment research and portfolio groups in our organization through the library usage statistics.  Every quarter and at the end of each fiscal year, using the database that captures library usage data, we produce a management report for each client group that shows how the members of each group used the library.  Among the main elements of a standardized one-page management report are requests volume, types of requests, number of documents researched and filtered by librarians, time saved by the library and a dollar value of saved time. In addition to charts and graphs, we also include brief descriptions of most important initiatives/projects that directly benefited our clients, and a list of team members who used the library and how often.  The report helps us to quantify the library work and show through the use of numbers the growing demand for library services worldwide.

In October 2008, after a series of cost cutting measures we went through the first round of downsizing.  Threats of economic and financial crisis suddenly became very real.  Concerned about the library, we needed to find a more effective marketing approach than just usage statistics to convey the message of value that the library brings to the investment process.  We had to somehow interpret and give a meaning to the year-end data/accomplishments in a way that would leave no doubts that the library is an important resource that contributes to the organization’s bottom line.  In other words, in this – as in any – crisis, good information is more important than ever, and that makes the library even more indispensable.

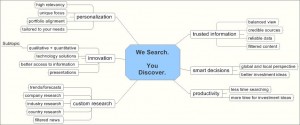
Below are the two idea maps that I created (using MindManager) to conceptualize in a simple visual way the key strategic areas where the library has an impact.  These maps compliment the statistical report which by its nature cannot clearly explain the library’s contribution to the company’s strategic goals and objectives.  The At-A-Glance map highlights our accomplishments in the context of what is highly relevant to all senior executives: cost control, improving productivity, risk management and competitive edge.  Because a lot of what we do is innovative, I am showing innovation as a foundation of all our initiatives.  The second map takes pretty much the same information but presents it in the context of the organization’s very specific strategic priorities.  We packaged the reports and maps together and put them on the library’s web page as a FY08 year-end review.


Has our new marketing approach worked? Were we able to send a strong value message across to those who make budget decisions? I don’t know for sure.  Unfortunately, we lost a dear friend and colleague to the second round of downsizing in January.  Could we have lost more people had we not tried to strengthen our marketing message using conceptualization and visualization techniques?  Possible, but it is hard to know.  What we know, however, is that seeing the emerging risk we tried a new approach and did the best we could to manage it.  

Library Marketing: Part 1

Best Practices, Idea Mapping Example, Library Marketing, Visualization 3 Comments »

Marketing is a combination of art and science. Or shall I say ‘right brain and left brain’?  2008 was marked by deep economic downturn, recession, fear and financial losses.  In the environment of cost cutting and downsizing, marketing becomes a powerful tool many managers use to communicate value their departments bring to organizations.  A corporate library is a service business.  Like in any service business, quantifying its impact is a difficult task.  How do you, for instance, put a price tag on information that leads to a profitable investment decision or saves from bad investment choices?  In this series, I’ll share some marketing ideas and best practices implemented in my library.

Season’s Greetings Post Card

We have a client-focused culture, putting our clients first. In fact, if you ask librarians, many will tell you that they enjoy working with their clients and go extra mile to satisfy and exceed their expectation.  To wish our clients a happy holiday season, we’ve created an electronic post card (for quick and easy delivery around the globe) with a giant snowflake and a look and feel of a traditional winter holidays card.  Except, we used the snowflake to convey key concepts and ideas that represent library services and values.  We wanted to highlight areas where we make impact in our clients’ lives, but do it indirectly, in a subtle way.  The card turned out to be a hit.

 Click to Enlarge

It is worth mentioning, that I used MindManager to conceptualize the snowflake’s branches and key word/key phrases.  I was working remotely and couldn’t talk face-to-face with Miroslava Litwak, who created a graphic design and did a great job turning the concept into a product.  Sending Miroslava a map (see below) reduced the need for multiple phone discussions and saved us a lot of production time.

Click to Enlarge

Frustration with Innovation Rises

Uncategorized 1 Comment »

Boston Consulting Group surveyed 3,000 executives worldwide and found out that a growing number of executives were frustrated with the return on their innovation investments.  Top factors contributing to diminished ROI in innovation were:

Difficulty picking right ideas for commercial development.

Long development time.

Lack of internal coordination.

Clearly, somebody needs to talk about idea mapping with these executives!

As promised, two more portraits from the IM workshop in Ft. Lauderdale.  Dreamy Merlin Monro is by Miroslava Litwak; the older gentleman is by Carol Rinaldi.


Awaken an Artist Hidden Inside You

Uncategorized  Tagged , 1 Comment »

During an Idea Mapping workshop in Ft. Lauderdale, research librarians learned various techniques to improve memory, enhance thought organization and bring team collaboration  to the next level.  All participants unanimously agreed that a non-traditional workshop format and innovative teaching method of engaging both sides of the brain helped them unlock creativity and innovative thinking.  One of the workshop’s brain-boosting activities required participants to draw a portrait in 50 minutes.  Except for Carol Rinaldi, who had drawn portraits in the past, majority was rather skeptical.  Picking up Andy Garcia, Donald Trump, Merlin Monro and other faces from the pile of portrait samples, people seemed to just go with the flow. Nevertheless, aplying a learing model introduced in the first part of the workshop, they lost themselves in the creative process, and the results were spectacular!  They were all amazed with realistic portraits they though they’d never be able to draw.  It was incredible to see how far our creative minds can take us if only we allow ourselves to be more creative.  See yourself: here is Donald Trump drawn in less than 50 minutes by Martin Wood.  I’ll share more portraits in the future posts.

.

Librarians Learn Idea Mapping

Uncategorized  Tagged , , No Comments »

Franklin Templeton librarians in Ft. Lauderdale attended a two-day Idea Mapping workshop to learn the benefits of the whole-brain approach to thinking, learning and planning. That was my very first workshop as a Certified Idea Mapping Instructor, and it was a lot of fun!


Idea Mapping, also known as Mind Mapping, is a whole-brain visual tool used by business people around the world to improve productivity, innovation and performance. Idea Mapping is based on discoveries made in neuroscience. It is effective because it mirrors how our brains naturally process and associate information making meaningful connections between pieces of data.  It creates synergy between right and left cortex skills integrating logic, lines, words, lists, numbers, and sequence with color and images. Using an idea map, thoughts and ideas can be effectively captured on a single sheet of paper making it easy to see and understand a big picture while still providing a way to include important details. 

  Using Idea Maps to Learn Faster

Idea maps can be used to accelerate learning and get new employees up to speed faster. Miroslava Litwak, who joined the library a few months ago as Digital Services Analyst, is using idea maps to learn about investment concepts behind charts and graphs she creates for the library clients.  Her map of the David Dreman’s book “Contrarian Investment Strategies” demonstrates key principles behind idea mapping such as using key words, images and color.


As you can see, creation of a map begins in the center with a main topic as a key word or an image.  Branches that represent key information related to the topic radiate from the main topic and spread clockwise throughout the page so that key ideas can be seen instantly.  Color, images and symbols activate creative areas of the right brain adding more fun to the thinking process and improving information recall.


Idea Mapping Book

Uncategorized  Tagged , , 2 Comments »

There are many ways to learn about Idea Mapping (IM) and how this visual thinking and learning tool can help people from all walks of life to become better at what they do, both in business and personal lives.  If you Google “idea mapping”, you’ll get over 46000 hits.  There are many books written on the subject, particularly by Tony Buzan who’s written prolifically on the topic of mind maps, memory and creativity.  There are dozens, if not hundreds, of blogs from the idea mapping practitioners around the globe.  

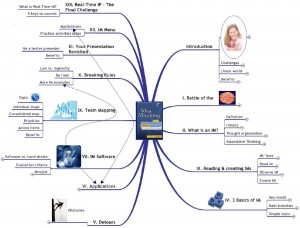
Today’s growing interest in the Idea Mapping is no accident.  With increasing complexity of the world we live in, we all are looking for the right answers and better decisions, for clarity and connections.  We want to learn faster and be more effective .   Perhaps, the best way to start learning about IM is to read the Idea Mapping book by Jamie Nast.  It includes everything a beginner needs to know, with a lot of practical exaples of IM applications.  The attached idea map is the book’s visual outline demonstrating key IM concepts.  Get the book – it may become one of your best investments. 

2008 SLA Conference

Uncategorized No Comments »

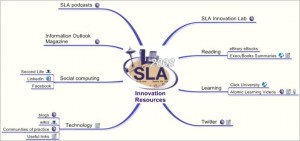
Held in the beautiful Emerald City, the 2008 SLA Conference was one of the best I’ve attended.  There were 5000 attendees and 283 exhibitors of which 50 attended for the first time demonstrating huge interest among both librarians and vendors.  The sessions and learning opportunities were outstanding, not to mention world-class speakers and presenters. I was particularly energized by the SLA vision for the library profession in the 21st century.  I thought that closing remarks delivered by Janice Lachance, SLA’s CEO,  were the conference’s highest point, showing deep understanding of our challenges as a profession and at the same time inspiring us with the vision of opportunities and possibilities.  I am thrilled about the Alignment Projectthat involves Outsell and Fleishman-Hillard, as well as futurists from Social Technologies, to improve our ability to better communicate our values to the world.  I love the concept of Innovation Lab,  and all the tools and resources we can use to become “cutting edge”.   A few distinguished people, including Vint Serf, Google’s Chief Internet Evangelist, made a point that the notion that knowledge is power is myth, it is sharing knowledge that matters.  To share what I’ve learned during the conference with my colleagues, I put together this idea map.

Using Idea Maps for Presentations

Uncategorized  Tagged , , , No Comments »

This year, my paper “Doing Library Business in India: A Success Story” won the Best Conference Paper Award at the Special Libraries Association’s annual conference held in Seattle June 16th through 19th.  This year’s conference theme was “Breaking Rules, Building Bridges”, and my paper was honored for innovative ideas and contribution to the scholarship of the SLA organization.  In line with the theme,  the paper describes how Franklin Templeton Library turned challenges of globalization into opportunities while breaking some rules and building bridges between the U.S. and Indian information professionals. 

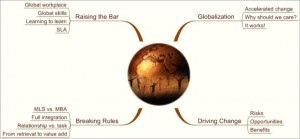
To present the paper at the conference, I decided to “break another rule”: instead of PowerPoint I used idea maps.   And it worked!  Using MindManager, I put together two simple maps: a cover map and a presentation map.  Instead of a dozen or so PPP slides, I had two slides with a single click in between (helped me to stay focused).  I also think that more holistic and visual representation of key points helped my audience to see a big picture and details at the same time.


WordPress Theme & Icons by N.Design Studio. WPMU Theme pack by WPMU-DEV.
Entries RSS Comments RSS Log in