MindJet Diary: Stimulus Package Project Planning
Global Teams, Idea Mapping Example, Project Management, Project Planning, Remote Collaboration, Visualization No Comments »We are currently working on an information guide to global stimulus packages and government bailouts around the world. The goal is to provide our clients with high quality information and resources to help them learn and understand the complex topic that keeps changing. Although we’ve done big research projects in the past (i.e. Financial Crisis in Perspective), this project presents special challenges.
-
The topic is a “moving target” and new information becomes available every day.
-
The volume of information is enormous. The topic is covered profusely by media, press and experts. We need to distill it to a manageable amount by analyzing and selecting the best pieces only.
-
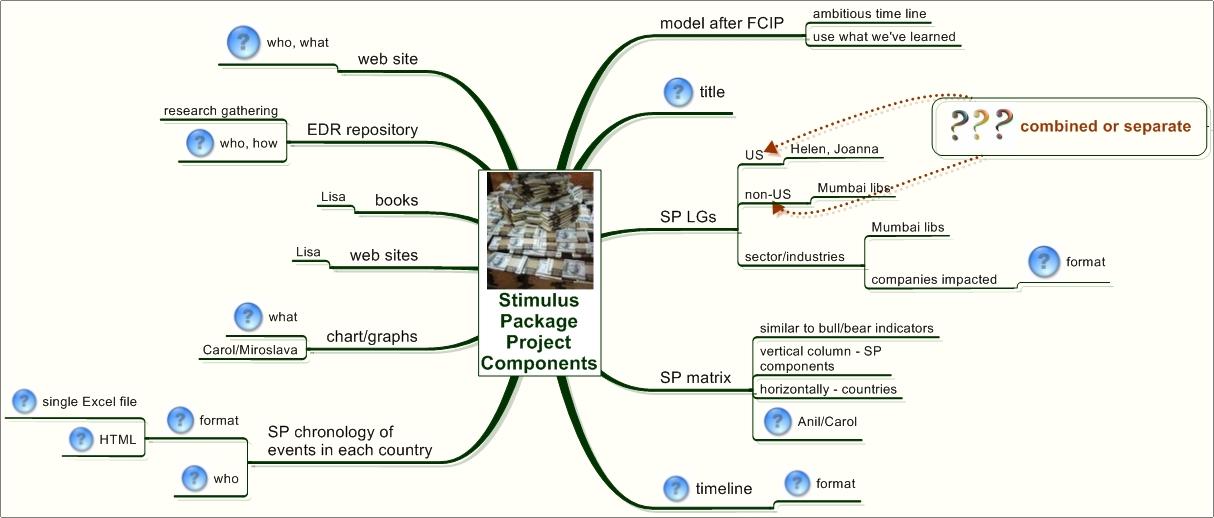
We want to create a multi-type guide that will include literature (research, news, opinions, and books), charts, graphs, metrics, web sites, etc. The challenge is that we are still developing a new methodology for this multi-sensory approach to information delivery and don’t have a clear road map for implementation.
-
It is a huge project with all 15 team members and 4 library locations involved in different aspects. Bridging communication and collaboration gaps is crucial to success of the project and how quickly we can deliver it to our clients.
-
Because the topic is in high demand, we must move fast and complete the project in 4 – 6 weeks.
After multiple preliminary discussions between different team members, we finalized our thoughts and ideas at the team meeting with the help of an idea map (see below). We’ve been using maps routinely in our work since January, and this time around – without a doubt – visualizing what we wanted to do enabled us to clearly see a big picture and at the same time determine smaller components. Through a 30-minute brainstorming session, we quickly realized the areas where we were unclear (branches with question marks) and gained needed clarity to move ahead. Without mapping, I believe we’d spend at least one more week in planning.
![[blinklist]](http://powermapping.ideamappingsuccess.com/IdeaMappingBlogs/wp-content/plugins/bookmarkify/blinklist.png)
![[BlogMarks]](http://powermapping.ideamappingsuccess.com/IdeaMappingBlogs/wp-content/plugins/bookmarkify/blogmarks.png)
![[Blogsvine]](http://powermapping.ideamappingsuccess.com/IdeaMappingBlogs/wp-content/plugins/bookmarkify/blogsvine.png)
![[del.icio.us]](http://powermapping.ideamappingsuccess.com/IdeaMappingBlogs/wp-content/plugins/bookmarkify/delicious.png)
![[Digg]](http://powermapping.ideamappingsuccess.com/IdeaMappingBlogs/wp-content/plugins/bookmarkify/digg.png)
![[diigo]](http://powermapping.ideamappingsuccess.com/IdeaMappingBlogs/wp-content/plugins/bookmarkify/diigo.png)
![[Facebook]](http://powermapping.ideamappingsuccess.com/IdeaMappingBlogs/wp-content/plugins/bookmarkify/facebook.png)
![[Jeqq]](http://powermapping.ideamappingsuccess.com/IdeaMappingBlogs/wp-content/plugins/bookmarkify/jeqq.png)
![[Ma.gnolia]](http://powermapping.ideamappingsuccess.com/IdeaMappingBlogs/wp-content/plugins/bookmarkify/magnolia.png)
![[Mister Wong]](http://powermapping.ideamappingsuccess.com/IdeaMappingBlogs/wp-content/plugins/bookmarkify/misterwong.png)
![[Netvouz]](http://powermapping.ideamappingsuccess.com/IdeaMappingBlogs/wp-content/plugins/bookmarkify/netvouz.png)
![[Newsvine]](http://powermapping.ideamappingsuccess.com/IdeaMappingBlogs/wp-content/plugins/bookmarkify/newsvine.png)
![[Propeller]](http://powermapping.ideamappingsuccess.com/IdeaMappingBlogs/wp-content/plugins/bookmarkify/propeller.png)
![[Reddit]](http://powermapping.ideamappingsuccess.com/IdeaMappingBlogs/wp-content/plugins/bookmarkify/reddit.png)
![[Slashdot]](http://powermapping.ideamappingsuccess.com/IdeaMappingBlogs/wp-content/plugins/bookmarkify/slashdot.png)
![[Sphinn]](http://powermapping.ideamappingsuccess.com/IdeaMappingBlogs/wp-content/plugins/bookmarkify/sphinn.png)
![[StumbleUpon]](http://powermapping.ideamappingsuccess.com/IdeaMappingBlogs/wp-content/plugins/bookmarkify/stumbleupon.png)
![[Technorati]](http://powermapping.ideamappingsuccess.com/IdeaMappingBlogs/wp-content/plugins/bookmarkify/technorati.png)
![[Twitter]](http://powermapping.ideamappingsuccess.com/IdeaMappingBlogs/wp-content/plugins/bookmarkify/twitter.png)
![[Email]](http://powermapping.ideamappingsuccess.com/IdeaMappingBlogs/wp-content/plugins/bookmarkify/email.png)