Maps for Gaps: Using Maps to Improve Communication and Understanding
Best Practices, Global Teams, Idea Mapping Example, Multi-Cultural Teams, Virtual Teams, Visualization No Comments »As a global team, most of our collaboration happens remotely. Over the years, we’ve implemented good communication practices, enhanced business processes and strengthened culture of collaboration. All of this, we’ve realized in the last few months, hasn’t been enough for achieving desired results in a timely fashion. Maturing as a team, we’ve come to conclusion that one of the big issues for us is communication quality, primarily the goal of achieving understanding and preventing misunderstanding.
Physical act and volume of communication don’t automatically mean true understanding. And identifying hidden spots of misunderstanding among team members is not easy but critical to the team’s success. Team members confirming that they understood concepts, tasks or assignments may genuinely believe that they are on the same page with others. Later, the final results, being less than expected, make everybody wonder how things could go off the desired track, in spite of the best communication practices used in the process. If you work on a virtual and multi-cultural team, this scenario happens quite often and can lead to loss of productivity, diminishing trust between team members and drop in service quality.
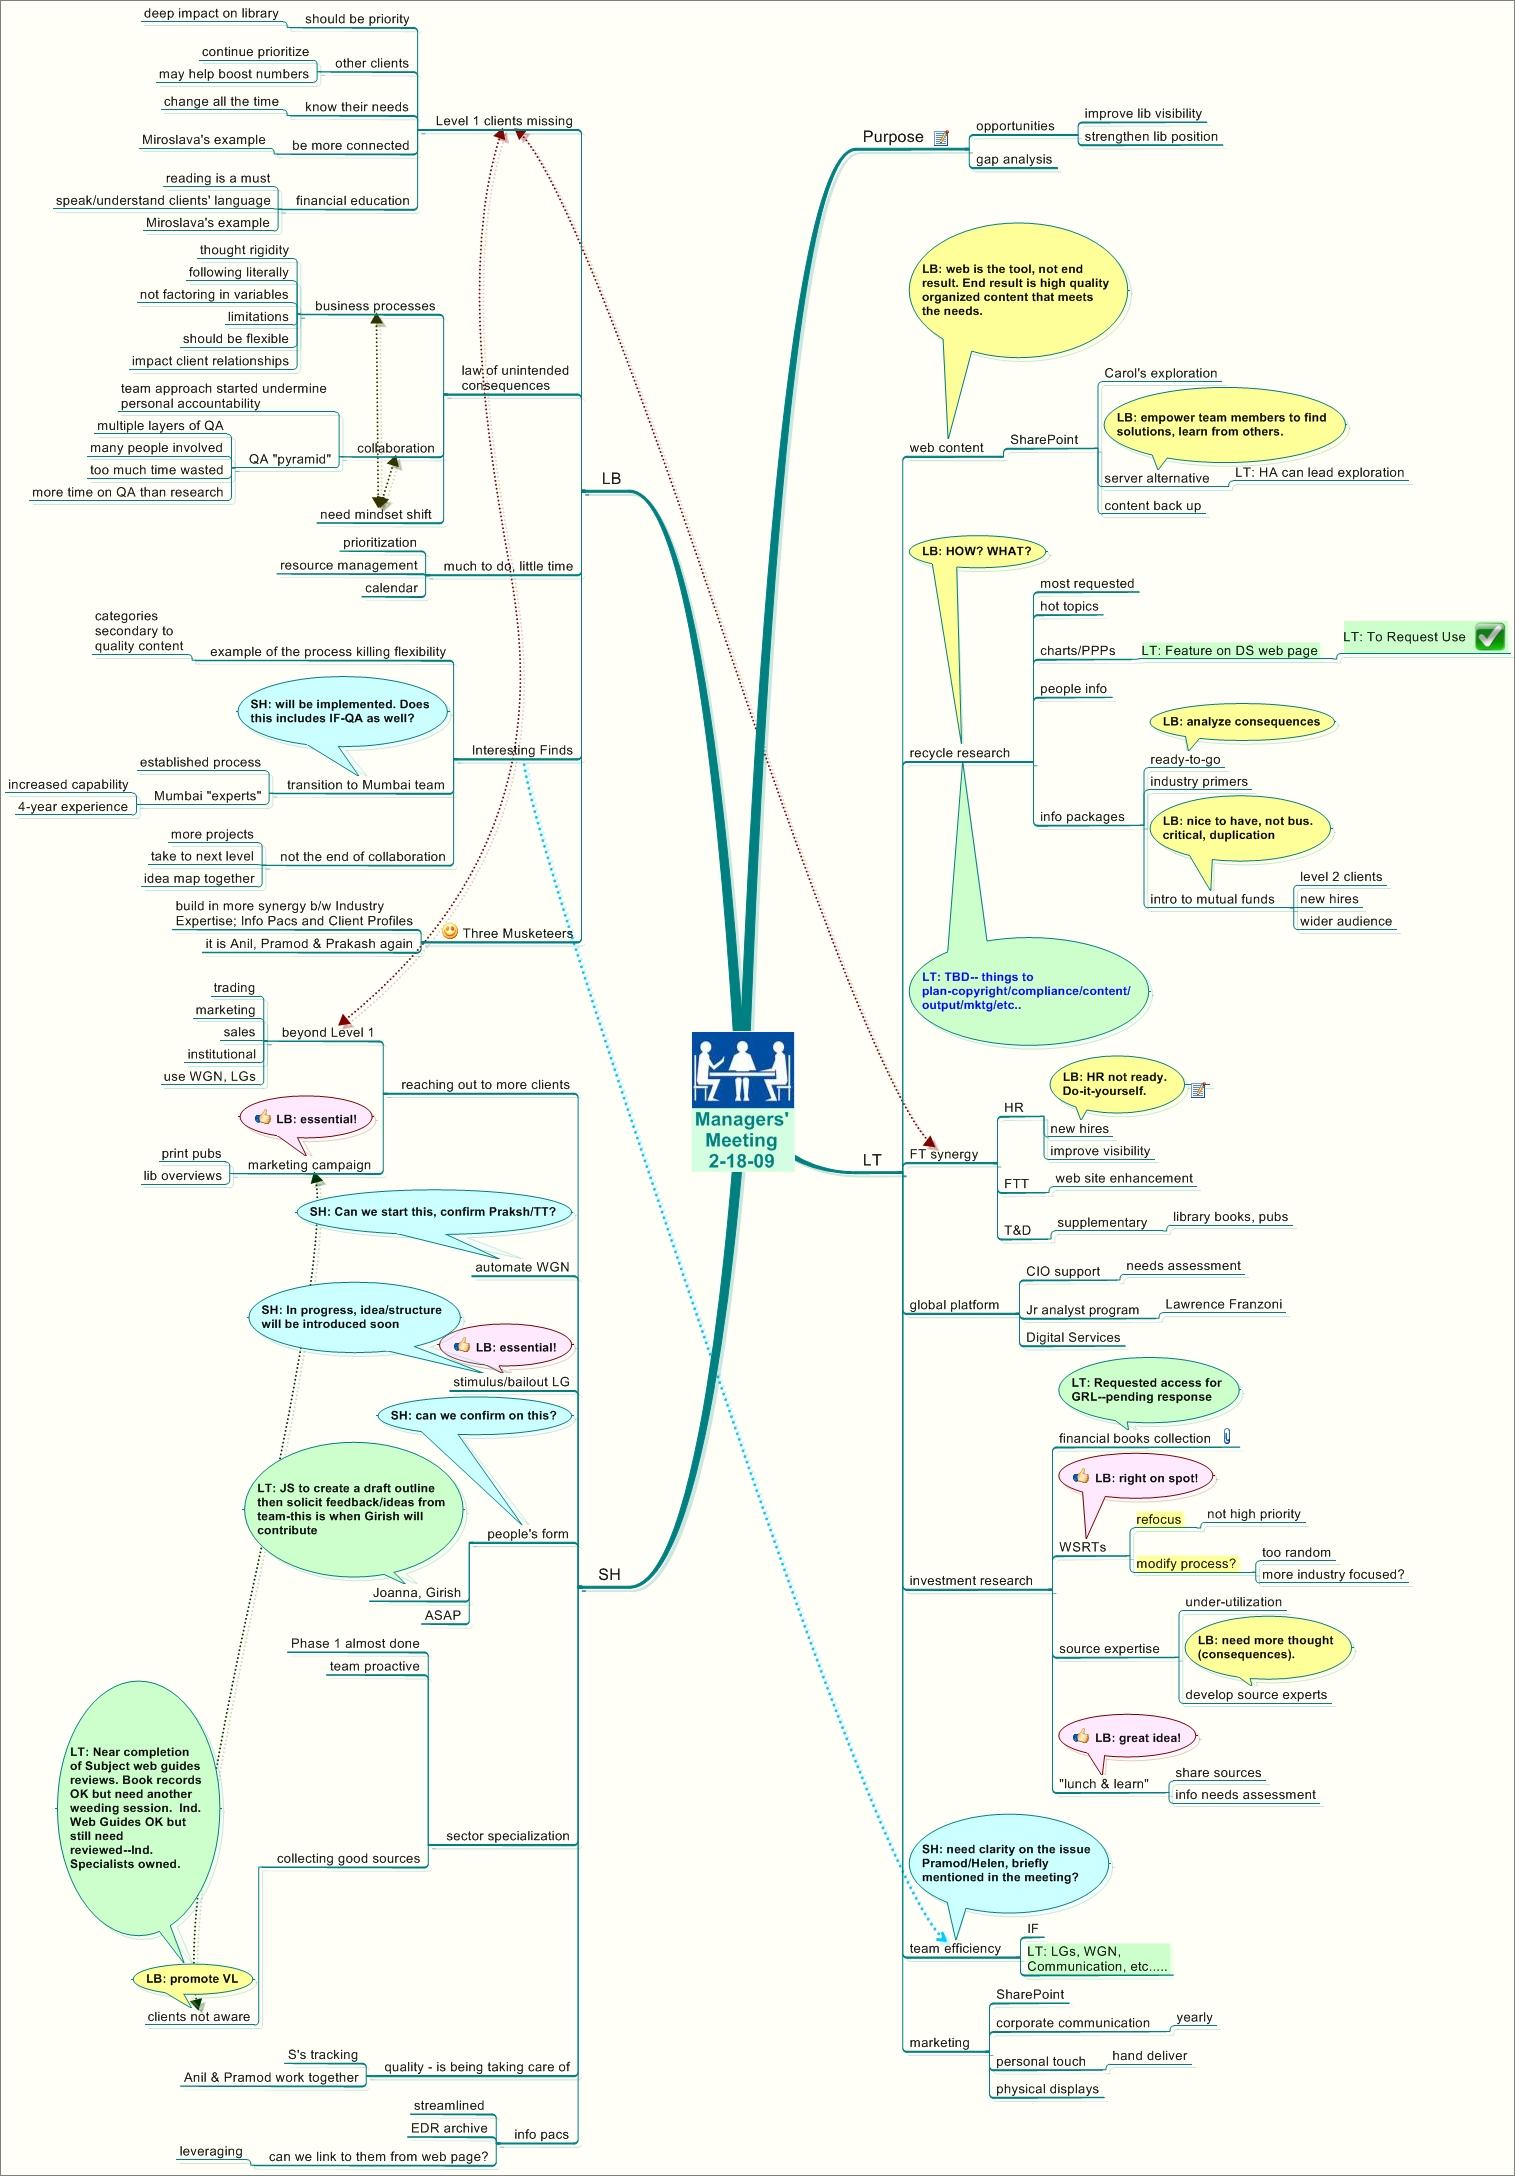
To identify and, ultimately prevent, misunderstanding, we started to use maps. For example, at the recent managers’ meeting, we shared ideas about emerging opportunities for the library during this worst recession in history. The one-and-a-half hour meeting was set up as a teleconference, with one manager calling from Mumbai, India. After the meeting, using MindManager, I created a map summarizing key concepts of our discussion, provided additional comments that I hadn’t had time to offer during the meeting, and invited meeting participants to insert comments or questions within the map. The managers reviewed the map and added a few callouts with questions and comments (see the attached map). There were about half-a-dozen questions in the map that were not asked during the meeting (either because of time constraints or other reasons) – showing to me that those areas needed further clarification. It is possible that if I hadn’t sent the post-meeting map, those questions might have never been asked, leading to misunderstanding and all unpleasant consequences that misunderstanding entails.

![[blinklist]](http://powermapping.ideamappingsuccess.com/IdeaMappingBlogs/wp-content/plugins/bookmarkify/blinklist.png)
![[BlogMarks]](http://powermapping.ideamappingsuccess.com/IdeaMappingBlogs/wp-content/plugins/bookmarkify/blogmarks.png)
![[Blogsvine]](http://powermapping.ideamappingsuccess.com/IdeaMappingBlogs/wp-content/plugins/bookmarkify/blogsvine.png)
![[del.icio.us]](http://powermapping.ideamappingsuccess.com/IdeaMappingBlogs/wp-content/plugins/bookmarkify/delicious.png)
![[Digg]](http://powermapping.ideamappingsuccess.com/IdeaMappingBlogs/wp-content/plugins/bookmarkify/digg.png)
![[diigo]](http://powermapping.ideamappingsuccess.com/IdeaMappingBlogs/wp-content/plugins/bookmarkify/diigo.png)
![[Facebook]](http://powermapping.ideamappingsuccess.com/IdeaMappingBlogs/wp-content/plugins/bookmarkify/facebook.png)
![[Jeqq]](http://powermapping.ideamappingsuccess.com/IdeaMappingBlogs/wp-content/plugins/bookmarkify/jeqq.png)
![[Ma.gnolia]](http://powermapping.ideamappingsuccess.com/IdeaMappingBlogs/wp-content/plugins/bookmarkify/magnolia.png)
![[Mister Wong]](http://powermapping.ideamappingsuccess.com/IdeaMappingBlogs/wp-content/plugins/bookmarkify/misterwong.png)
![[Netvouz]](http://powermapping.ideamappingsuccess.com/IdeaMappingBlogs/wp-content/plugins/bookmarkify/netvouz.png)
![[Newsvine]](http://powermapping.ideamappingsuccess.com/IdeaMappingBlogs/wp-content/plugins/bookmarkify/newsvine.png)
![[Propeller]](http://powermapping.ideamappingsuccess.com/IdeaMappingBlogs/wp-content/plugins/bookmarkify/propeller.png)
![[Reddit]](http://powermapping.ideamappingsuccess.com/IdeaMappingBlogs/wp-content/plugins/bookmarkify/reddit.png)
![[Slashdot]](http://powermapping.ideamappingsuccess.com/IdeaMappingBlogs/wp-content/plugins/bookmarkify/slashdot.png)
![[Sphinn]](http://powermapping.ideamappingsuccess.com/IdeaMappingBlogs/wp-content/plugins/bookmarkify/sphinn.png)
![[StumbleUpon]](http://powermapping.ideamappingsuccess.com/IdeaMappingBlogs/wp-content/plugins/bookmarkify/stumbleupon.png)
![[Technorati]](http://powermapping.ideamappingsuccess.com/IdeaMappingBlogs/wp-content/plugins/bookmarkify/technorati.png)
![[Twitter]](http://powermapping.ideamappingsuccess.com/IdeaMappingBlogs/wp-content/plugins/bookmarkify/twitter.png)
![[Email]](http://powermapping.ideamappingsuccess.com/IdeaMappingBlogs/wp-content/plugins/bookmarkify/email.png)
