Library Marketing: Part 2
Idea Mapping Example, Library Marketing, Visualization No Comments »For many years, we’ve measured the impact of the professional library and information services on investment research and portfolio groups in our organization through the library usage statistics. Every quarter and at the end of each fiscal year, using the database that captures library usage data, we produce a management report for each client group that shows how the members of each group used the library. Among the main elements of a standardized one-page management report are requests volume, types of requests, number of documents researched and filtered by librarians, time saved by the library and a dollar value of saved time. In addition to charts and graphs, we also include brief descriptions of most important initiatives/projects that directly benefited our clients, and a list of team members who used the library and how often. The report helps us to quantify the library work and show through the use of numbers the growing demand for library services worldwide.
In October 2008, after a series of cost cutting measures we went through the first round of downsizing. Threats of economic and financial crisis suddenly became very real. Concerned about the library, we needed to find a more effective marketing approach than just usage statistics to convey the message of value that the library brings to the investment process. We had to somehow interpret and give a meaning to the year-end data/accomplishments in a way that would leave no doubts that the library is an important resource that contributes to the organization’s bottom line. In other words, in this – as in any – crisis, good information is more important than ever, and that makes the library even more indispensable.
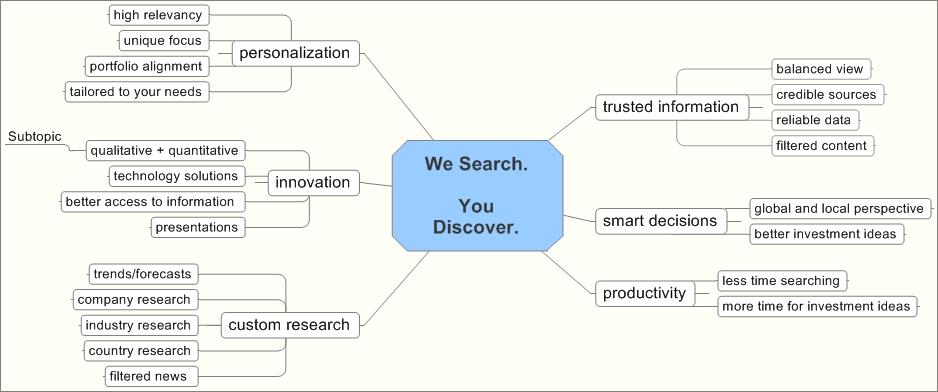
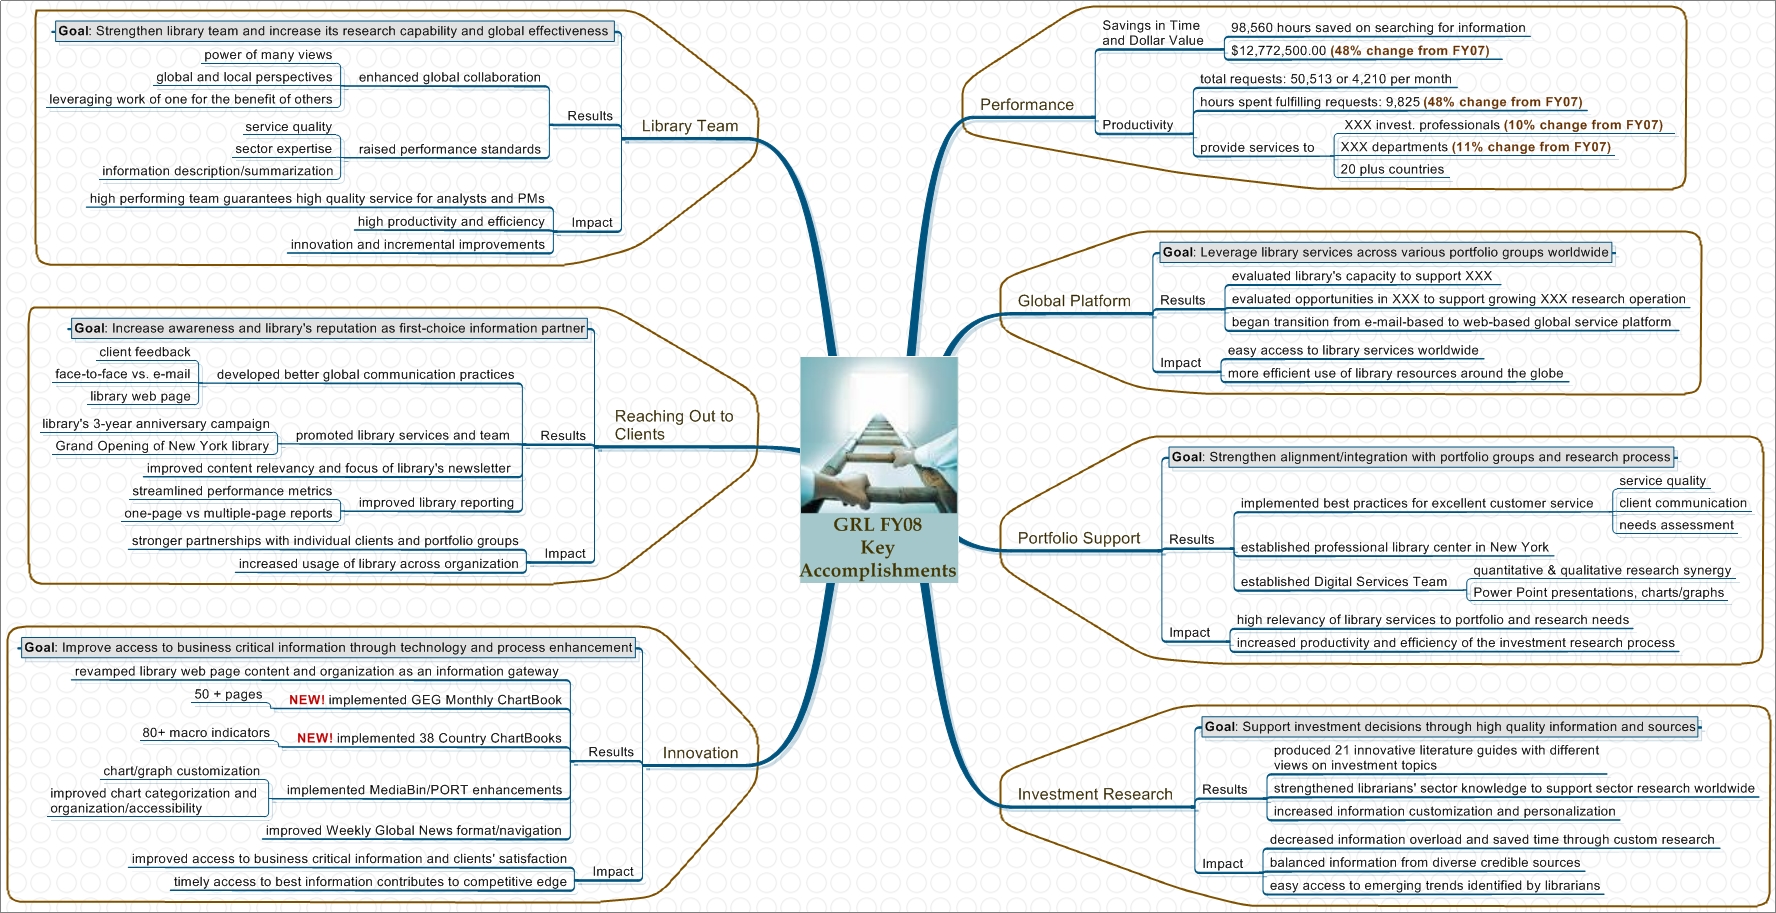
Below are the two idea maps that I created (using MindManager) to conceptualize in a simple visual way the key strategic areas where the library has an impact. These maps compliment the statistical report which by its nature cannot clearly explain the library’s contribution to the company’s strategic goals and objectives. The At-A-Glance map highlights our accomplishments in the context of what is highly relevant to all senior executives: cost control, improving productivity, risk management and competitive edge. Because a lot of what we do is innovative, I am showing innovation as a foundation of all our initiatives. The second map takes pretty much the same information but presents it in the context of the organization’s very specific strategic priorities. We packaged the reports and maps together and put them on the library’s web page as a FY08 year-end review.

Has our new marketing approach worked? Were we able to send a strong value message across to those who make budget decisions? I don’t know for sure. Unfortunately, we lost a dear friend and colleague to the second round of downsizing in January. Could we have lost more people had we not tried to strengthen our marketing message using conceptualization and visualization techniques? Possible, but it is hard to know. What we know, however, is that seeing the emerging risk we tried a new approach and did the best we could to manage it.
![[blinklist]](http://powermapping.ideamappingsuccess.com/IdeaMappingBlogs/wp-content/plugins/bookmarkify/blinklist.png)
![[BlogMarks]](http://powermapping.ideamappingsuccess.com/IdeaMappingBlogs/wp-content/plugins/bookmarkify/blogmarks.png)
![[Blogsvine]](http://powermapping.ideamappingsuccess.com/IdeaMappingBlogs/wp-content/plugins/bookmarkify/blogsvine.png)
![[del.icio.us]](http://powermapping.ideamappingsuccess.com/IdeaMappingBlogs/wp-content/plugins/bookmarkify/delicious.png)
![[Digg]](http://powermapping.ideamappingsuccess.com/IdeaMappingBlogs/wp-content/plugins/bookmarkify/digg.png)
![[diigo]](http://powermapping.ideamappingsuccess.com/IdeaMappingBlogs/wp-content/plugins/bookmarkify/diigo.png)
![[Facebook]](http://powermapping.ideamappingsuccess.com/IdeaMappingBlogs/wp-content/plugins/bookmarkify/facebook.png)
![[Jeqq]](http://powermapping.ideamappingsuccess.com/IdeaMappingBlogs/wp-content/plugins/bookmarkify/jeqq.png)
![[Ma.gnolia]](http://powermapping.ideamappingsuccess.com/IdeaMappingBlogs/wp-content/plugins/bookmarkify/magnolia.png)
![[Mister Wong]](http://powermapping.ideamappingsuccess.com/IdeaMappingBlogs/wp-content/plugins/bookmarkify/misterwong.png)
![[Netvouz]](http://powermapping.ideamappingsuccess.com/IdeaMappingBlogs/wp-content/plugins/bookmarkify/netvouz.png)
![[Newsvine]](http://powermapping.ideamappingsuccess.com/IdeaMappingBlogs/wp-content/plugins/bookmarkify/newsvine.png)
![[Propeller]](http://powermapping.ideamappingsuccess.com/IdeaMappingBlogs/wp-content/plugins/bookmarkify/propeller.png)
![[Reddit]](http://powermapping.ideamappingsuccess.com/IdeaMappingBlogs/wp-content/plugins/bookmarkify/reddit.png)
![[Slashdot]](http://powermapping.ideamappingsuccess.com/IdeaMappingBlogs/wp-content/plugins/bookmarkify/slashdot.png)
![[Sphinn]](http://powermapping.ideamappingsuccess.com/IdeaMappingBlogs/wp-content/plugins/bookmarkify/sphinn.png)
![[StumbleUpon]](http://powermapping.ideamappingsuccess.com/IdeaMappingBlogs/wp-content/plugins/bookmarkify/stumbleupon.png)
![[Technorati]](http://powermapping.ideamappingsuccess.com/IdeaMappingBlogs/wp-content/plugins/bookmarkify/technorati.png)
![[Twitter]](http://powermapping.ideamappingsuccess.com/IdeaMappingBlogs/wp-content/plugins/bookmarkify/twitter.png)
![[Email]](http://powermapping.ideamappingsuccess.com/IdeaMappingBlogs/wp-content/plugins/bookmarkify/email.png)